Initially the budget function aims to find the relation between sale data and “labor goal”, my first thought is to do linear regression without any transformation.
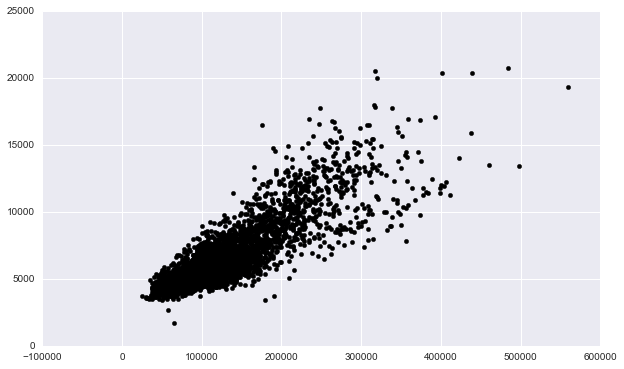
First take a look at the scatter plot of all data points.

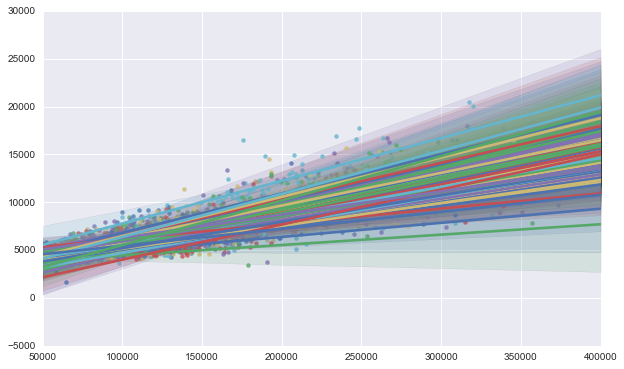
For fun, plot the overall regression plot for each store, shown in the same graph.

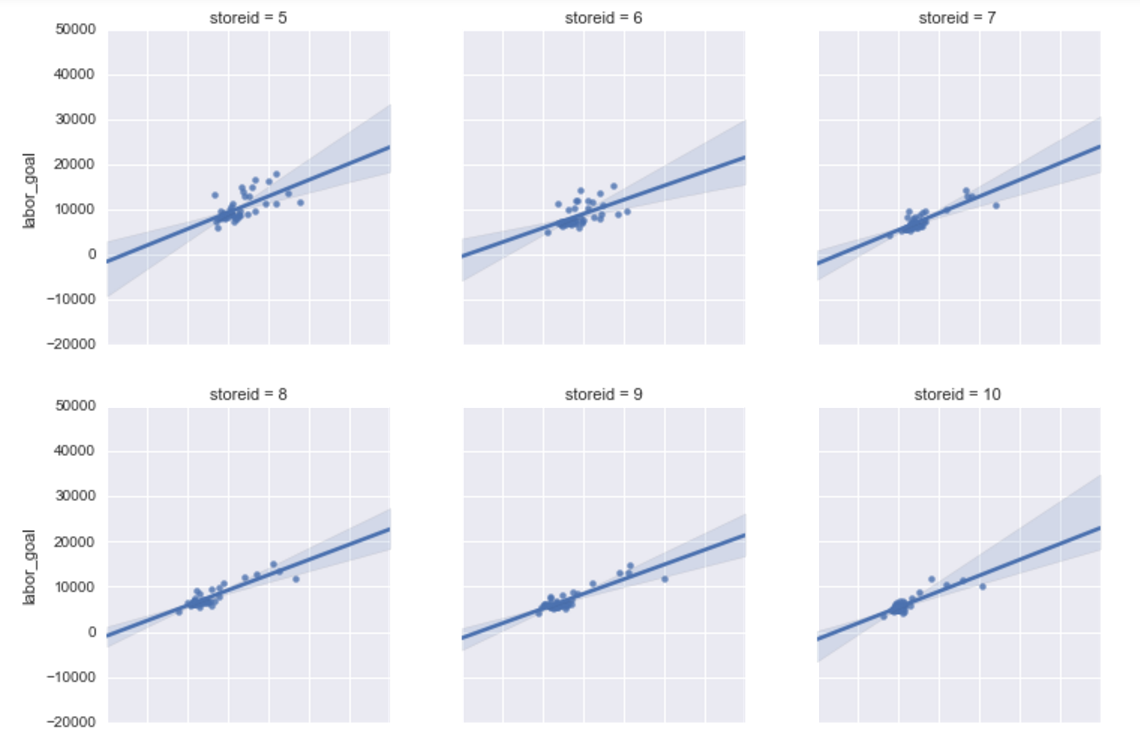
Plot regression forms on each store, note that logically speaking budget function is designed for each store.1sns.lmplot(x="actual_sales", y="labor_goal", col="storeid", data=df_demand, size=3.5,col_wrap=3,aspect=1)
The question will follow that how to judge if the linear regression really works? I.e., is a linear relationship between X and y justified?


